
Turning UK Biobank’s 500,000-Person Cohort Into Therapeutic Hypotheses with an AI Agent
Co-developed by Professor Manuel Rivas (Stanford Biomedical Data Science) and Gregory Minevich (Founding Member of Technical Staff at Phylo)
Introducing the Genetic Target Hypothesis skill, co-developed with Prof. Manuel Rivas at Stanford, which transforms rare-variant burden statistics from UK Biobank into ranked therapeutic target hypotheses in minutes. In a BMI/obesity case study, the system rediscovered canonical biology such as MC4R with the correct inhibit/activate direction, while surfacing novel candidate targets for follow-up.
Genetic Target Hypothesis skill | BMI Case Study
GeneBass (Karczewski et al., 2022) reports gene-based association tests across 394,841 UK Biobank exomes, 4,529 phenotypes, and 19,407 protein-coding genes. For this BMI & obesity phenotype-family run (BMI plus sex-stratified BMI, weight, weight-adjusted-for-height, and obesity ICD codes), that’s 308,413 phenotype-gene-annotation tests across predicted loss-of-function (pLoF) variants and missense|LC variants (missense plus low-confidence LoF calls). Somewhere in that table are genes that, when reduced or functionally perturbed by rare variants, change a person’s BMI — some already drug targets, others completely unknown.
Analyzing them by hand means opening multiple browser tabs: Open Targets for constraint and tractability, GTEx for tissue expression, ClinicalTrials.gov, PubMed, CellxGene for single-cell data. You work gene by gene, assembling a picture that lives across spreadsheets and memory. For one phenotype, this takes days. For a portfolio of indications, weeks.
We built a Biomni skill that compresses this into minutes: give it a phenotype name, and it returns a ranked, annotated set of therapeutic target hypotheses with a structured PDF report. The skill is co-developed with Professor Manuel Rivas at Stanford Biomedical Data Science, who has published on using rare-variant burden tests from UK Biobank exome data to identify causal gene-disease relationships (DeBoever et al., 2018).
Here’s how it works, and what it found for BMI.
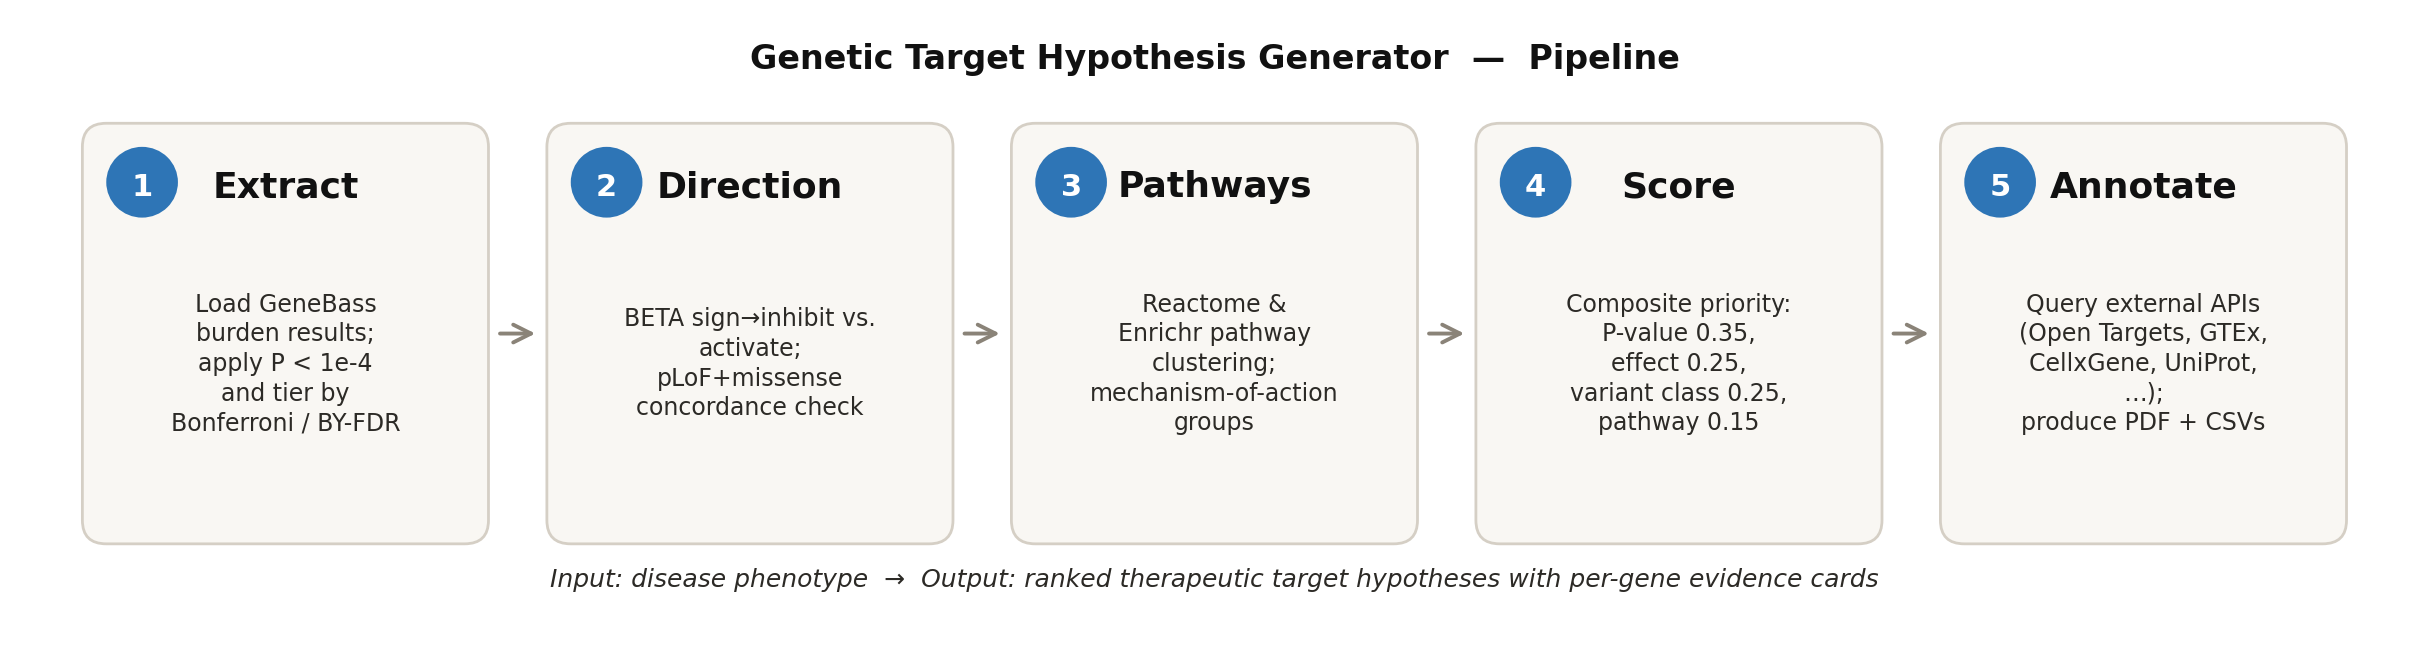
Figure 1. Pipeline overview. Five steps convert GeneBass burden statistics into a ranked, annotated set of therapeutic target hypotheses.
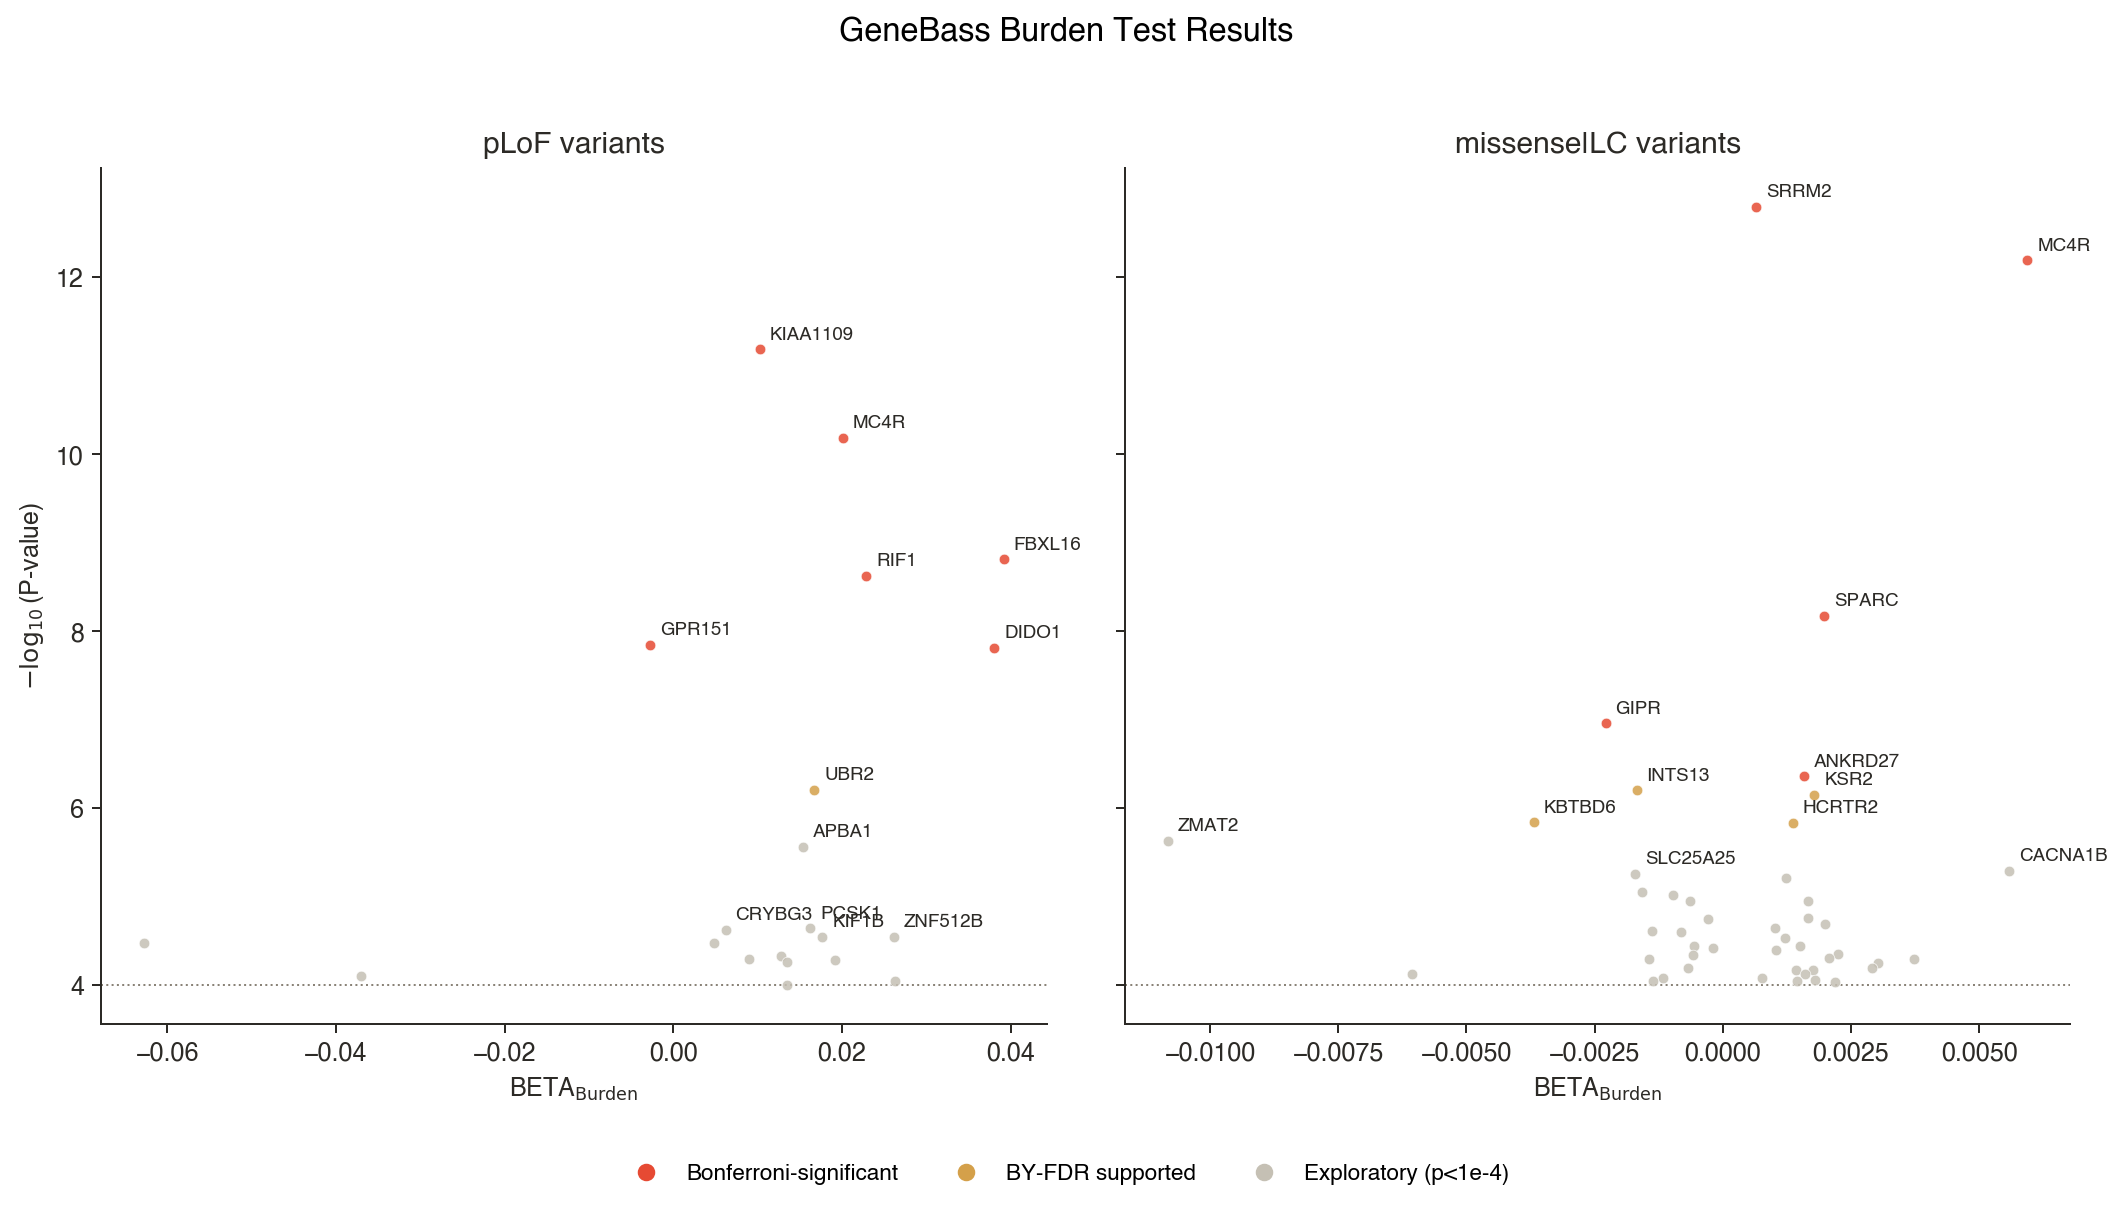
Figure 2. Volcano plots of BMI burden test results, split by annotation class (pLoF, left; missense|low confidence pLoF, right). Color by stringency tier: red = Bonferroni-significant; orange = BY-FDR supported; grey = exploratory (P < 1e-4). BETA > 0 indicates loss-of-function increases BMI; BETA < 0 indicates loss-of-function decreases BMI.
Why rare variants are a better starting point for target hypotheses
Most genetic target identification starts with common-variant GWAS signals. The problem: ~90% of GWAS hits are non-coding (Visscher et al., 2017), most sit in LD blocks spanning multiple genes and require extensive fine-mapping to connect a signal to a causal gene (Schaid et al., 2018). Even then, the direction of effect on the gene product is often ambiguous (Gallagher & Chen-Plotkin, 2018).
Rare-variant burden testing flips this. Foundational work showed that systematically running gene-level rare-variant tests across thousands of phenotypes in biobank exomes recovers known and novel gene–disease associations (Cirulli et al., 2020). GeneBass aggregates qualifying rare variants within each gene, including predicted loss-of-function (pLoF) and missense|LC annotations, and tests whether carrying them collectively affects a phenotype. The signal is gene-level from the start. And because pLoF variants are expected to reduce or abolish gene function, the sign of the BETA coefficient provides a direct first-pass therapeutic strategy:
BETA < 0: Losing gene function reduces the phenotype (e.g., lowers BMI). Therapeutic direction: inhibit the gene product to mimic the protective loss-of-function.
BETA > 0: Losing gene function increases the phenotype (e.g., raises BMI). Therapeutic direction: activate the gene product, because the natural version is protective.
When a gene shows significant burden in both pLoF and missense categories with the same BETA direction (concordant), confidence in the therapeutic hypothesis is high. Building on a P < 1e-4 discovery threshold, we layer on both Bonferroni correction (Dunn, 1961) and Benjamini–Yekutieli FDR (Benjamini & Yekutieli, 2001) across the full per-phenotype test family, creating three statistical tiers: Bonferroni-significant, FDR-supported, and exploratory.
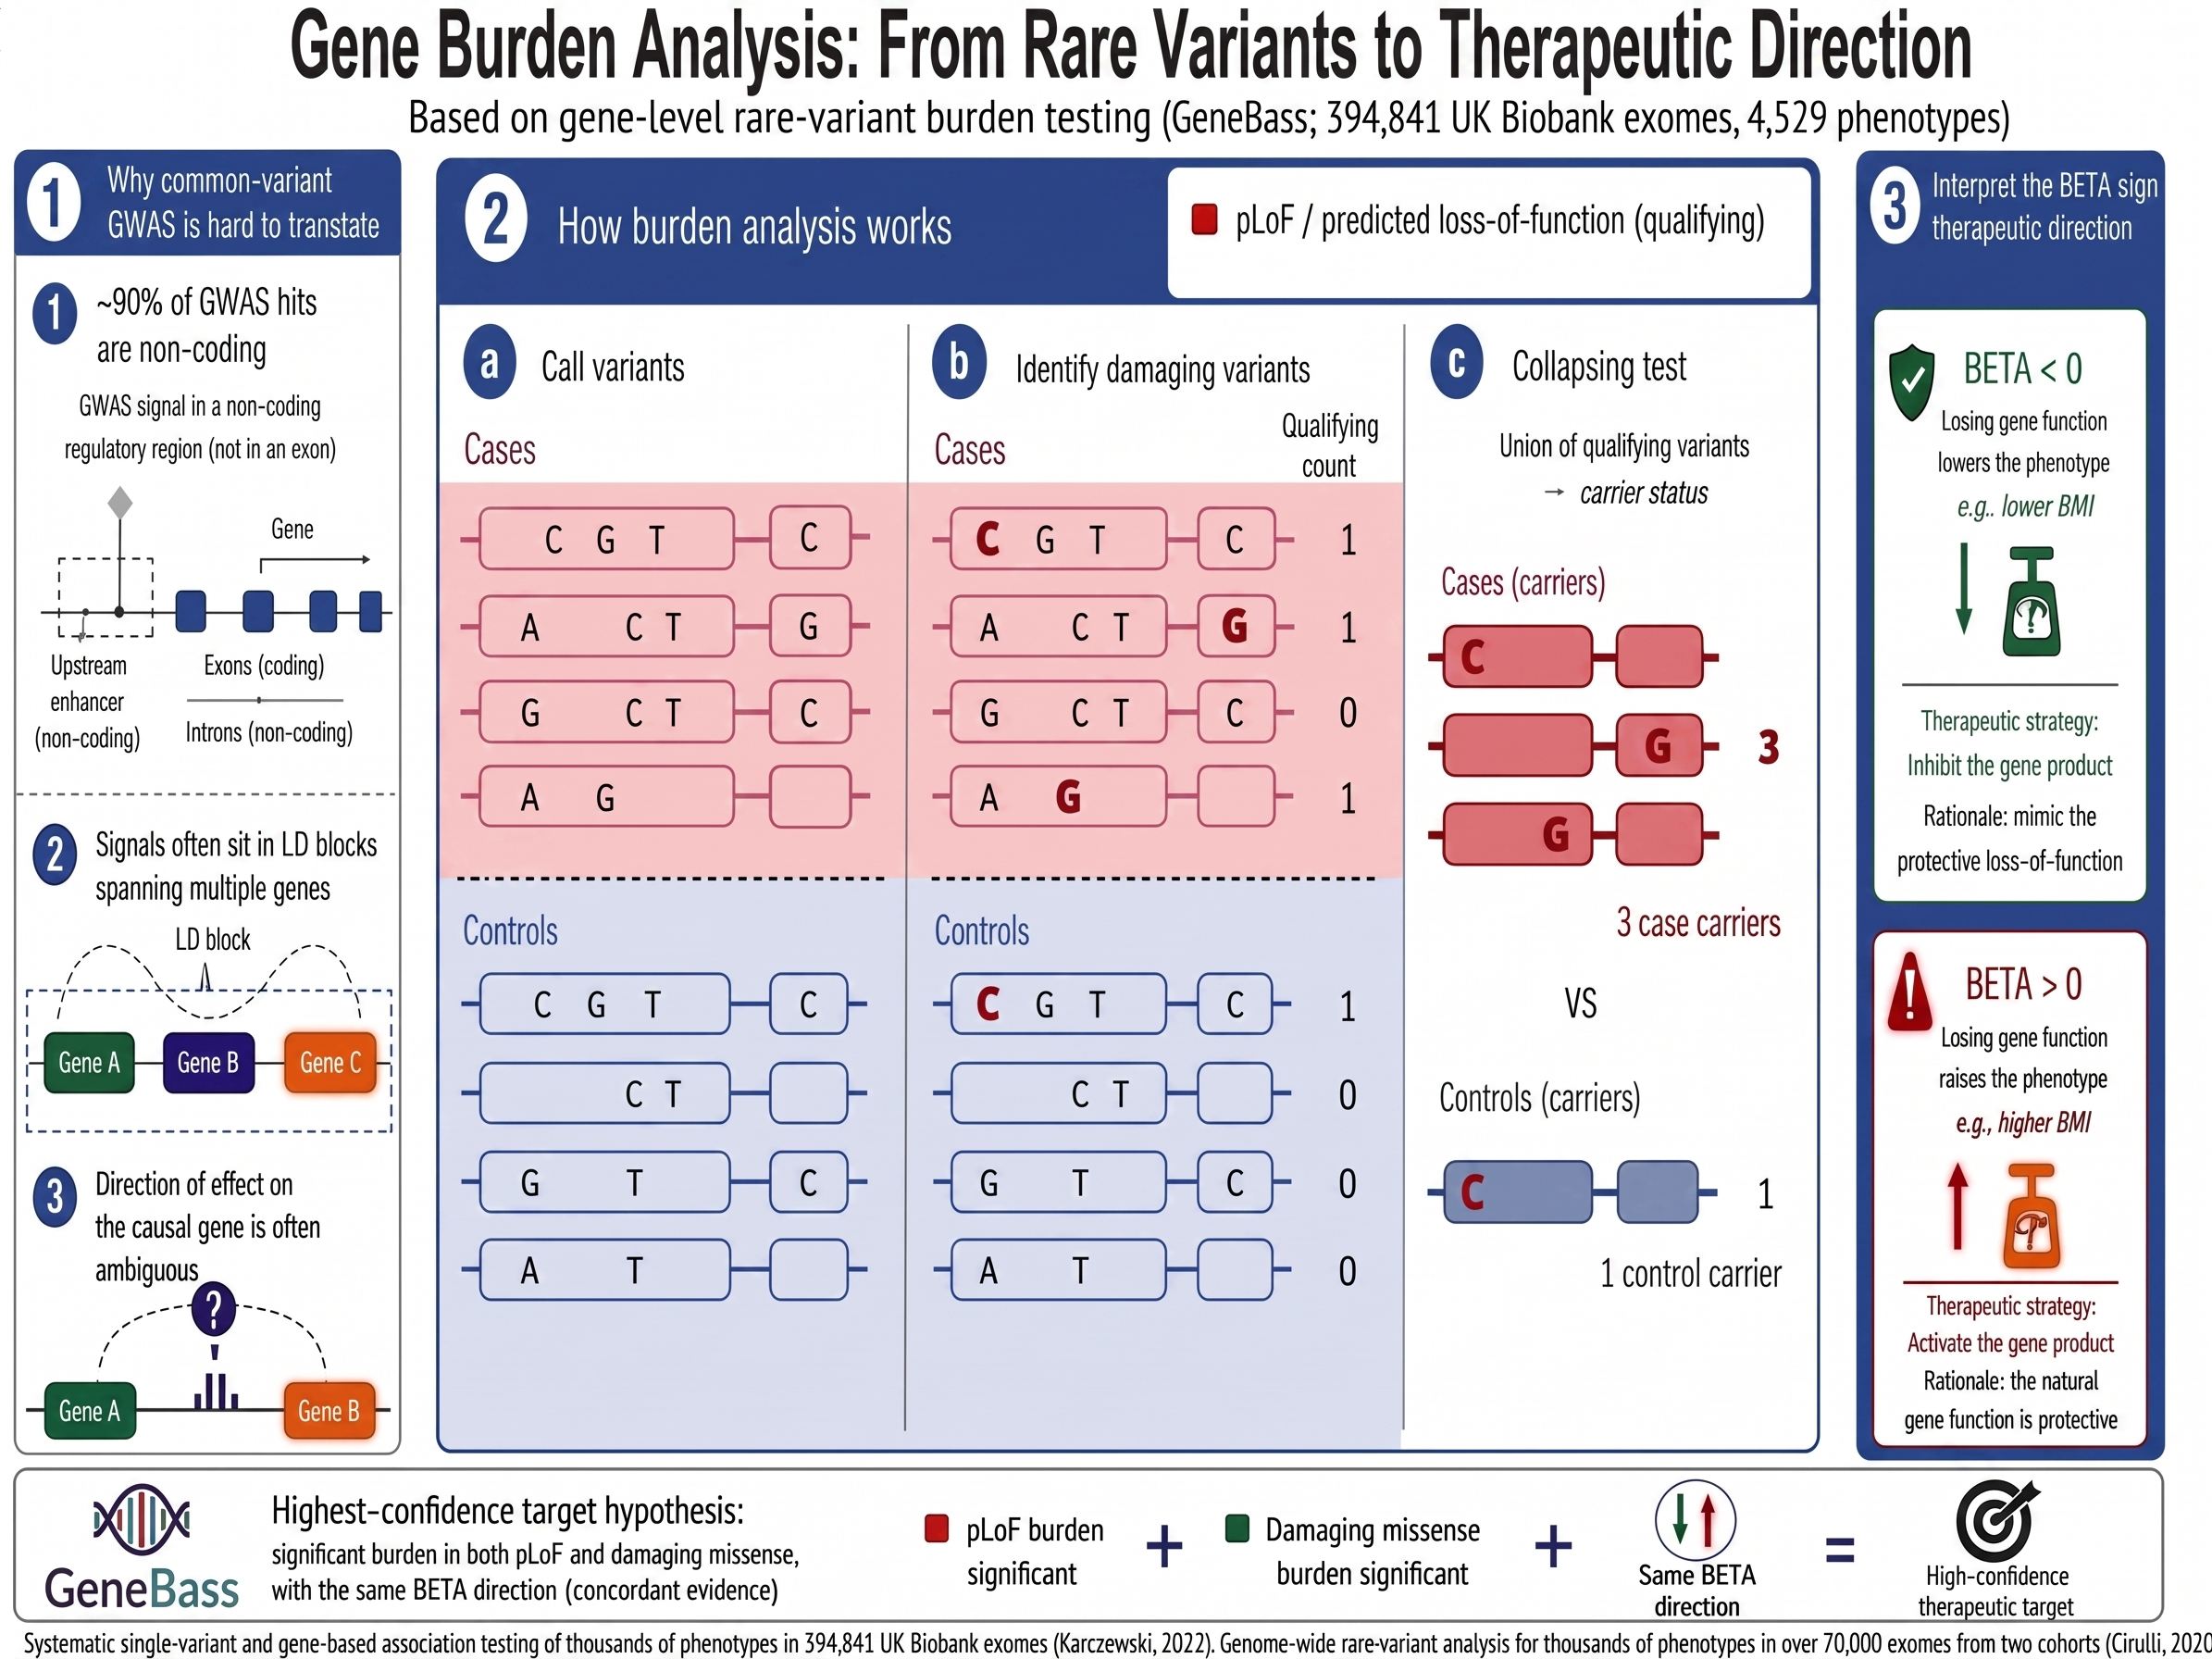
Figure 3. Gene burden analysis: from rare variants to therapeutic direction. Why common-variant GWAS often fails to translate, how rare-variant burden testing collapses qualifying variants gene-by-gene, and how the sign of BETA reads out as inhibit or activate.
What the pipeline does
The skill runs a five-step pipeline with a deliberate design principle: genetics drives the ranking, and everything else is context.
Step 1 – Extract discovery genes. Load GeneBass burden results for the selected phenotype (fuzzy-matched from user input), apply a discovery threshold (raw P < 1e-4), and assign statistical tiers using Bonferroni and BY-FDR correction across all tested gene–annotation pairs. Inputs are the publicly released GeneBass burden summary statistics, which include phenotype selection and SKAT-O keep filters but do not re-apply gene-level QC, per-call genotype-quality filters, or the unrelated-sample filter from the original pipeline; downstream orthogonal validation is recommended before prioritizing any individual hypothesis. GeneBass is derived from UK Biobank exomes; the broader UK Biobank cohort is predominantly of European ancestry (~94%) (Bycroft et al., 2018), and the exome subset has a similar composition (Karczewski et al., 2022). Direction-of-effect calls may be more stable than discovery sets or effect-size estimates, but replication in ancestry-diverse cohorts (All of Us, FinnGen, BioBank Japan) is still advisable.
Step 2 – Infer therapeutic direction. For each discovery gene, the BETA sign determines inhibit vs. activate. Genes appearing in both pLoF and missense results get a concordance assessment.
Step 3 – Pathway convergence. Reactome pathway memberships from Open Targets are aggregated, and genes sharing biological pathways are clustered into mechanism-of-action groups. Over-representation analysis (via the gseapy library against Reactome, KEGG, and GO Biological Process gene sets) identifies enriched terms.
Step 4 – Genetic priority scoring. Each gene receives a composite score from four components, all anchored in direct genetic evidence:
| Component | Weight | What it captures |
|---|---|---|
| P-value strength | 0.35 | Statistical significance of the burden association |
| Effect size | 0.25 | Magnitude of the BETA coefficient |
| Variant class support | 0.25 | pLoF+missense concordance (highest) vs. single class |
| Pathway convergence | 0.15 | Shared biology with other discovery genes |
A small orthogonal bonus (max 0.05) is added when independent Open Targets genetic evidence agrees with the GeneBass direction; final scores are capped at 1.00. Genes scoring above 0.65 are HIGH priority; 0.40–0.65 are MEDIUM; below 0.40 are LOW.
Step 5 – Annotate and report. In parallel, the pipeline queries Open Targets (Ochoa et al., 2023; constraint, tractability, drugs, mouse knockouts), GTEx and ARCHS4 (tissue expression), CZI CellxGene (single-cell expression), UniProt and NCBI (protein function), PMC (literature), and ClinicalTrials.gov (clinical trial matches). These annotations provide translational context but do not inflate the genetic rank. The output is a PDF report with figures, per-gene hypothesis cards, and companion CSVs.
BMI: what the pipeline found
Running the pipeline on the BMI & obesity phenotype family identified 178 unique genes from 308,413 phenotype-gene-annotation tests across six related BMI/obesity phenotypes: 82 inhibition targets and 96 activation targets. Nineteen genes cleared the most stringent Bonferroni threshold (P < 1.62e-07); eighteen more were supported by BY-FDR but did not reach Bonferroni significance; the remaining 141 passed only the exploratory raw P < 1e-4 threshold. The exploratory tier is hypothesis-generating, not validated: these signals warrant orthogonal confirmation (e.g., replication in All of Us or FinnGen, eQTL colocalization, or model-organism evidence) before being prioritized for programs.
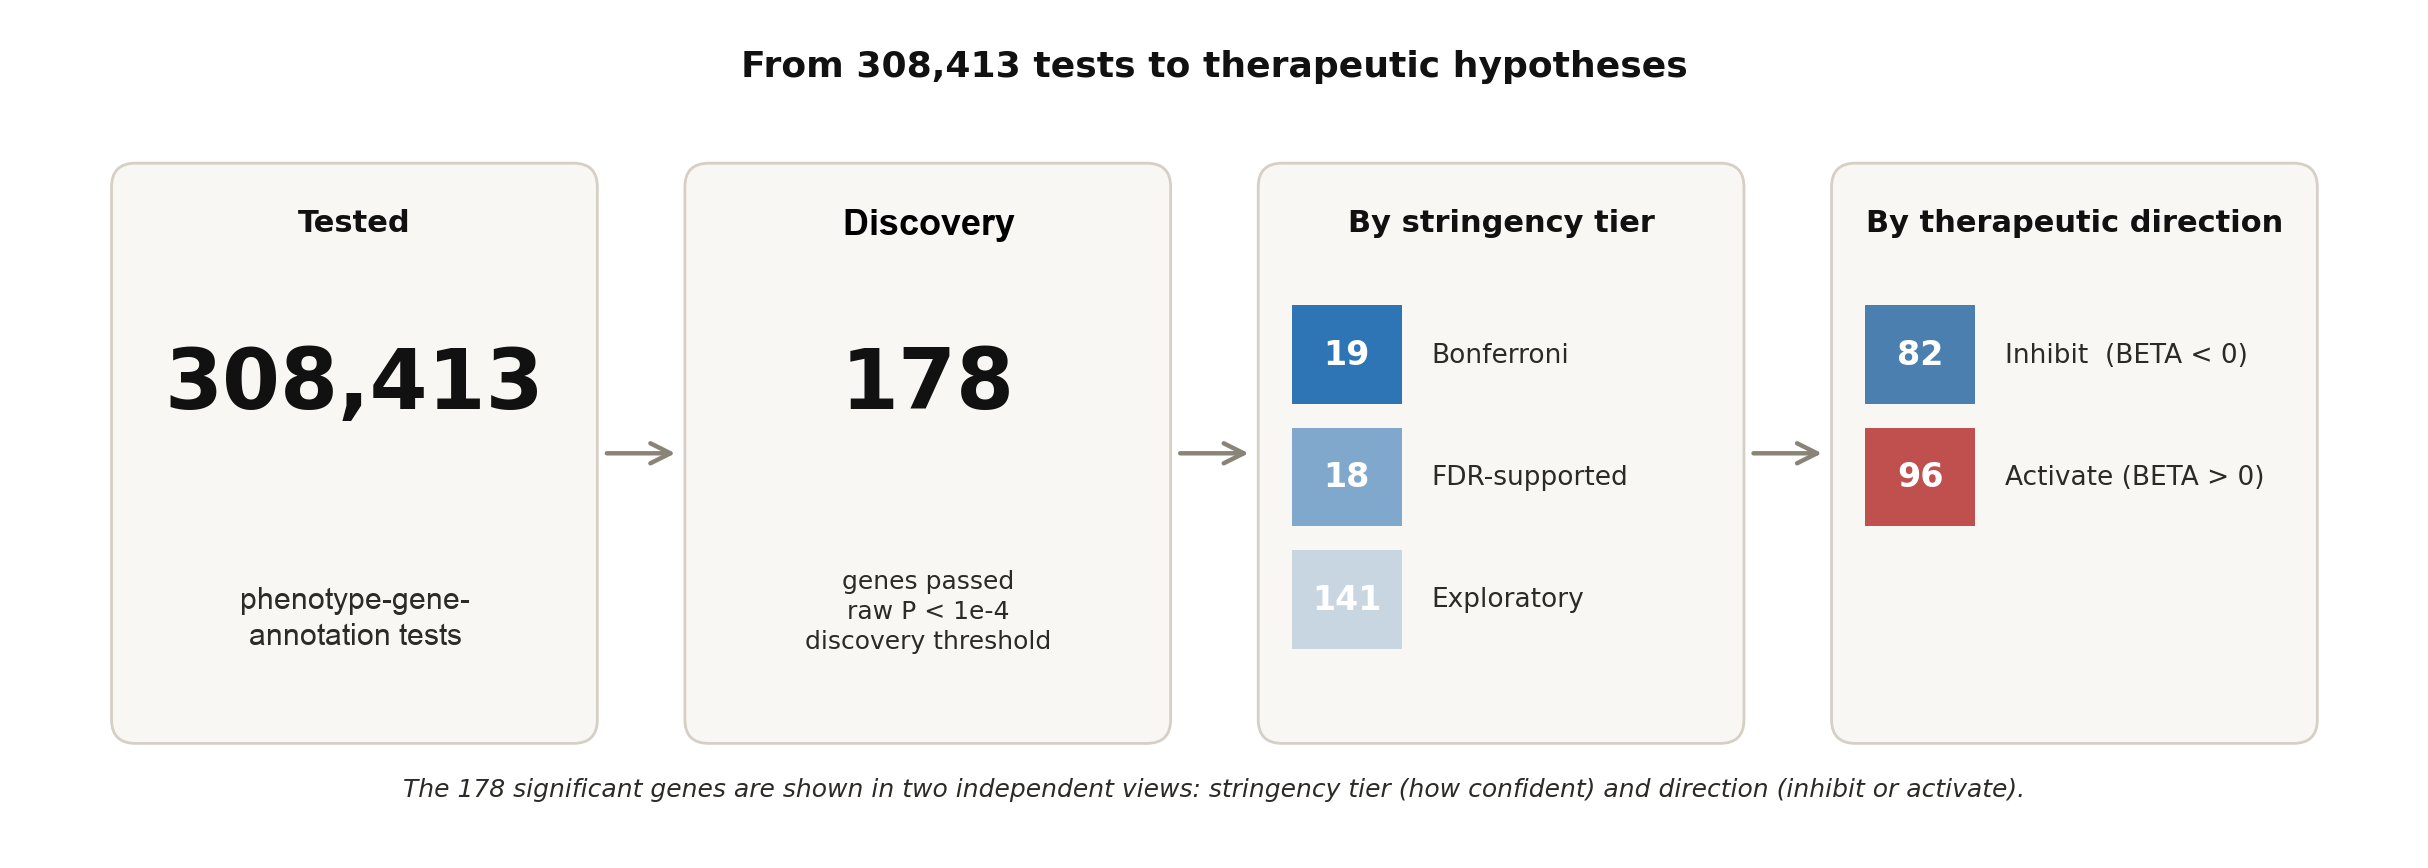
Figure 4. Scale of the BMI & obesity run. Of 308,413 phenotype-gene-annotation tests, 178 genes passed the discovery threshold; these are shown split by statistical stringency and by predicted therapeutic direction.
The genetic priority score classified 18 genes as HIGH, 83 as MEDIUM, and 77 as LOW.
The top targets
| Gene | Direction | Score | Tier | Key evidence | Known drugs |
|---|---|---|---|---|---|
| MC4R | Activate | 0.85 | HIGH | pLoF + missense|LC concordant; P = 2.80e-15 | setmelanotide, bremelanotide |
| FBXL16 | Activate | 0.835 | HIGH | pLoF, Bonferroni-significant; P = 1.05e-10 | None |
| SETD1B | Activate | 0.812 | HIGH | pLoF, exploratory; P = 2.34e-05 | None |
| IRS1 | Inhibit | 0.791 | HIGH | pLoF, Bonferroni-significant; P = 6.59e-11 | aganirsen (non-obesity) |
| ZNF512B | Activate | 0.781 | HIGH | pLoF, exploratory; P = 9.54e-07 | None |
The pipeline rediscovered known obesity biology
The strongest validation comes from genes where the pipeline’s prediction matches approved therapeutics.
- MC4R is the textbook case. The melanocortin-4 receptor is a leading monogenic obesity gene (Loos & Yeo, 2022). Loss-of-function mutations increase BMI — the pipeline sees this as concordant pLoF and missense|LC burden with BETA > 0 (pLoF P = 6.5e-11; missense|LC P = 2.80e-15), correctly predicting activation as the therapeutic strategy. Setmelanotide, an FDA-approved MC4R agonist for specific rare genetic obesity disorders (Markham, 2021), validates the same direction in defined MC4R-pathway biology. The pipeline arrived at that direction from burden statistics alone.
- IRS1 is an inhibition-side metabolic biology example, not a de-risked obesity target. pLoF burden with BETA < 0 (P = 6.59e-11) predicts that reducing IRS1 lowers BMI. This is broadly consistent with prior human adiposity genetics near IRS1, but those same signals also point to insulin-resistance and cardiometabolic liabilities (Kilpeläinen et al., 2011). Aganirsen, an IRS1-targeted antisense oligonucleotide investigated as topical ocular therapy for neovascular eye disease, shows that IRS1 knockdown pharmacology exists, but it does not validate systemic IRS1 inhibition for obesity. A metabolic program would require tissue-selective or partial modulation and careful safety testing.
- PCSK1, which processes prohormones including pro-opiomelanocortin in the MC4R pathway, appears in the exploratory tier as an activation target with concordant pLoF and missense|LC evidence — further supporting the biological coherence of the results.
Novel hypotheses worth investigating
Beyond validation, the pipeline surfaced targets without existing drug programs:
- FBXL16: Score 0.835, Bonferroni-significant pLoF burden (P = 1.05e-10). Expressed in brain nucleus accumbens (TPM 736.1, tau 0.88). No known drugs and minimal literature — a strong genetic signal without an existing drug program.
- DIDO1: Score 0.709, Bonferroni-significant pLoF burden (P = 1.54e-08), activation target. Zero publications retrieved by the literature query — one of the most under-explored hits in the run.
- VGF: Score 0.766, HIGH-priority inhibition target (exploratory tier, P = 1.75e-05) with high tissue specificity (τ = 0.94) concentrated in pituitary (TPM 138.3) — a biologically plausible focus for BMI regulation.
- RIF1: Score 0.661, Bonferroni-significant pLoF burden (P = 2.35e-09), activation target. Zero publications retrieved by the literature query — an attractive candidate for functional validation.
The pipeline also grouped the significant genes into 11 descriptive mechanism clusters by shared Reactome pathway membership; mechanism clusters group by pathway co-membership and can include genes with different therapeutic directions, distinct from the per-direction Reactome aggregation used elsewhere in the report. The featured clusters include Kinesins, G alpha (s) signalling (MC4R and PDE3B as activate; GIPR and GPR37 as inhibit), G alpha (q) signalling, RHOV GTPase cycle, and ion transport by P-type ATPases (ATP13A1, ATP8B2, ATP2B4). No pathway reached statistical significance after multiple-testing correction in this run — the clusters describe biological co-membership, not enrichment.
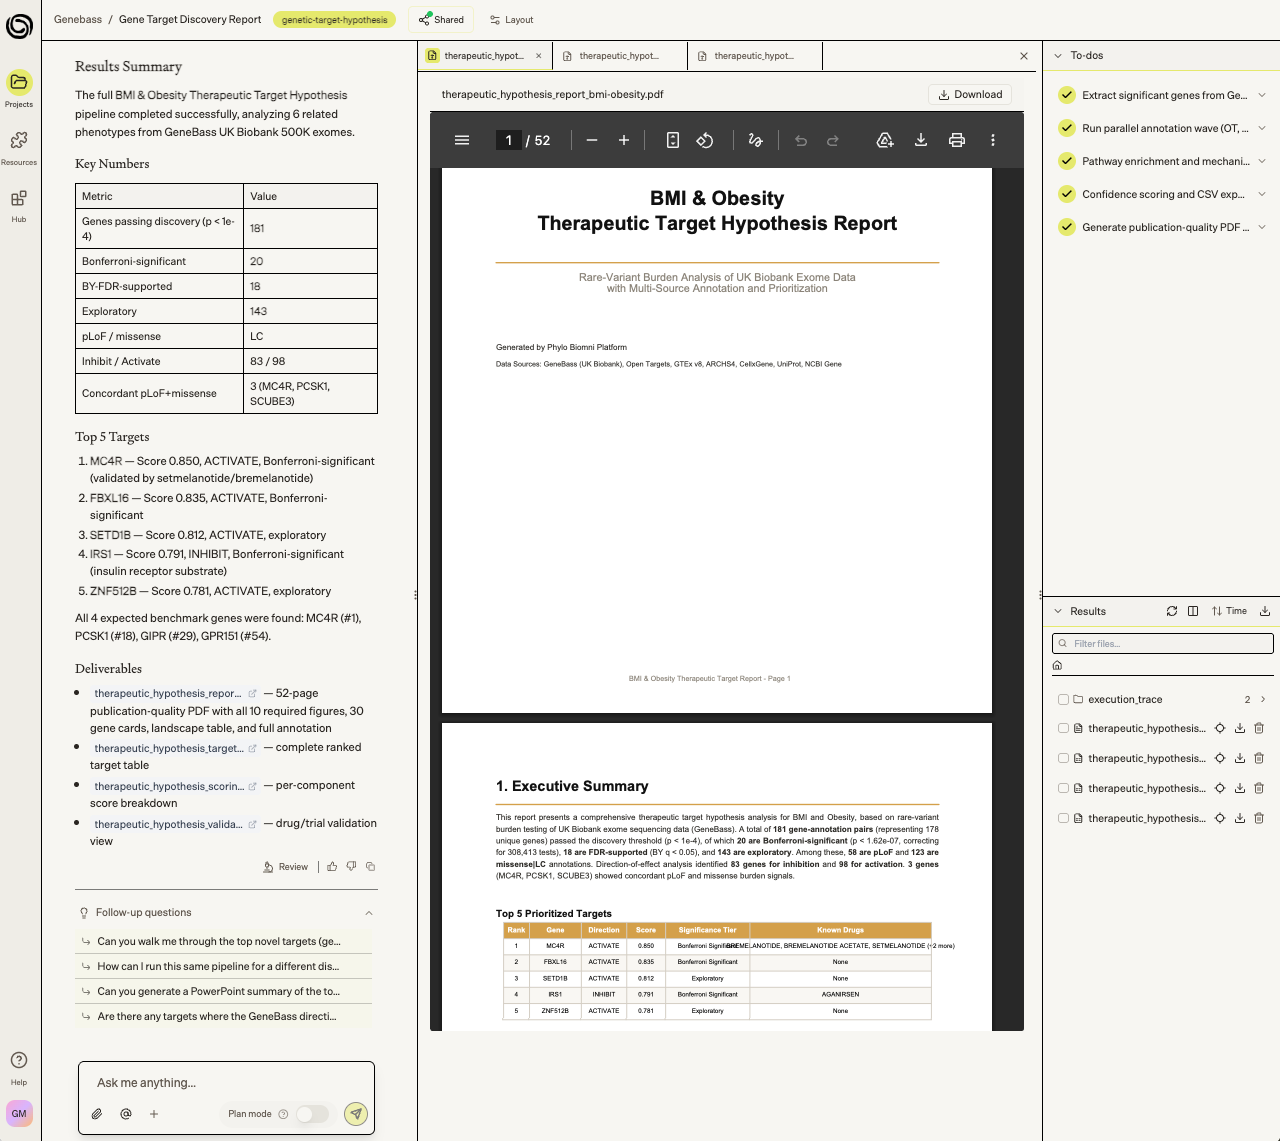
Figure 5. Screenshot of analysis results including PDF report within the Biomni platform.
What this means
This pipeline works for any of the 4,000+ phenotypes in GeneBass. Type 2 diabetes, Alzheimer’s disease, asthma, LDL cholesterol — same workflow, minutes instead of days. Output quality scales with signal: biomarker traits with strong carrier counts (T2D, LDL cholesterol, BMI) yield cleaner hypothesis sets than sparse or self-reported phenotypes.
Each gene comes with a hypothesis card: therapeutic direction, GeneBass statistics, Open Targets annotations, tissue expression profiles from GTEx and single-cell data, literature context, clinical trial matches, and direction-of-effect concordance across independent evidence sources. The companion CSVs feed directly into downstream workflows like eQTL colocalization, TWAS review, and functional validation triage.
The deliberate choice to keep genetics as the primary scoring driver — rather than letting annotation richness dominate — means well-studied genes don’t automatically rise to the top. A novel gene with strong pLoF burden and pathway convergence outranks a heavily annotated gene with weak genetic evidence. Some particularly interesting targets have little existing literature.
The human exome data exists. The public databases exist. The analytical logic is well-established. What’s been missing is the infrastructure to bring it all together systematically, reproducibly, and fast enough to explore a portfolio of indications rather than one disease at a time.
The Genetic Target Hypothesis skill is available as a Biomni skill and it is built into our target prioritization and indication expansion apps — reach out to learn more.
References
Benjamini, Y., & Yekutieli, D. (2001). The control of the false discovery rate in multiple testing under dependency. The Annals of Statistics, 29(4), 1165–1188. https://doi.org/10.1214/aos/1013699998
Bycroft, C., Freeman, C., Petkova, D., et al. (2018). The UK Biobank resource with deep phenotyping and genomic data. Nature, 562(7726), 203–209. https://pubmed.ncbi.nlm.nih.gov/30305743/
Cirulli, E. T., White, S., Read, R. W., Elhanan, G., Metcalf, W. J., Tanudjaja, F., Fath, D. M., Sandoval, E., Isaksson, M., Schlauch, K. A., Grzymski, J. J., Lu, J. T., & Washington, N. L. (2020). Genome-wide rare variant analysis for thousands of phenotypes in over 70,000 exomes from two cohorts. Nature Communications, 11(1), 542. https://www.nature.com/articles/s41467-020-14288-y
DeBoever, C., Tanigawa, Y., Lindholm, M. E., et al. (2018). Medical relevance of protein-truncating variants across 337,205 individuals in the UK Biobank study. Nature Communications, 9, 1612. https://doi.org/10.1038/s41467-018-03910-9
Dunn, O. J. (1961). Multiple comparisons among means. Journal of the American Statistical Association, 56(293), 52–64. https://doi.org/10.1080/01621459.1961.10482090
Gallagher, M. D., & Chen-Plotkin, A. S. (2018). The post-GWAS era: from association to function. The American Journal of Human Genetics, 102(5), 717–730. https://pubmed.ncbi.nlm.nih.gov/29727686/
Karczewski, K. J., Solomonson, M., Chao, K. R., Goodrich, J. K., Tiao, G., Lu, W., Riley-Gillis, B. M., Tsai, E. A., Kim, H. I., Zheng, X., Rahimov, F., Esmaeeli, S., Grundstad, A. J., Reppell, M., Waring, J., Jacob, H., Sexton, D., Bronson, P. G., Chen, X., … Neale, B. M. (2022). Systematic single-variant and gene-based association testing of thousands of phenotypes in 394,841 UK Biobank exomes. Cell Genomics, 2(9), 100168. https://pubmed.ncbi.nlm.nih.gov/36778668/
Kilpeläinen, T. O., Zillikens, M. C., Stančáková, A., Finucane, F. M., Ried, J. S., Langenberg, C., Zhang, W., Beckmann, J. S., Luan, J., Vandenput, L., Styrkarsdottir, U., Zhou, Y., Smith, A. V., Zhao, J. H., Amin, N., Vedantam, S., Shin, S. Y., Haritunians, T., Fu, M., … Loos, R. J. F. (2011). Genetic variation near IRS1 associates with reduced adiposity and an impaired metabolic profile. Nature Genetics, 43(8), 753–760. https://www.nature.com/articles/ng.866
Loos, R. J. F., & Yeo, G. S. H. (2022). The genetics of obesity: from discovery to biology. Nature Reviews Genetics, 23(2), 120–133. https://doi.org/10.1038/s41576-021-00414-z
Markham, A. (2021). Setmelanotide: First approval. Drugs, 81(3), 397–403. https://doi.org/10.1007/s40265-021-01470-9
Ochoa, D., Hercules, A., Carmona, M., Suveges, D., Baker, J., Malangone, C., Lopez, I., Miranda, A., Cruz-Castillo, C., Fumis, L., Bernal-Llinares, M., Tsukanov, K., Cornu, H., Tsirigos, K., Razuvayevskaya, O., Buniello, A., Schwartzentruber, J., Karim, M., Ariano, B., … McDonagh, E. M. (2023). The next-generation Open Targets Platform: reimagined, redesigned, rebuilt. Nucleic Acids Research, 51(D1), D1353–D1359. https://doi.org/10.1093/nar/gkac1046
Schaid, D. J., Chen, W., & Larson, N. B. (2018). From genome-wide associations to candidate causal variants by statistical fine-mapping. Nature Reviews Genetics, 19(8), 491–504. https://doi.org/10.1038/s41576-018-0016-z
Visscher, P. M., Wray, N. R., Zhang, Q., Sjostrand, P., Sidorenko, J., Yengo, L., & Yang, J. (2017). 10 years of GWAS discovery: Biology, function, and translation. American Journal of Human Genetics, 101(1), 5–22. https://doi.org/10.1016/j.ajhg.2017.06.005